
In accordance with the Southern Association of Colleges and Schools Commission on Colleges, T.A. Lawson State Community College identifies, evaluates, and publishes goals and outcomes for student achievement appropriate to the institution's mission, the nature of the students it serves, and the kinds of programs offered. Lawson State utilizes IPEDS data and SACSCOC Annual Profile data as a metrix to monitor completion of students served by the College.
The College documents successful student achievement in relation to its Mission by monitoring measures such as course completion rates, retention rates, transfer rates, state licensing examinations, and job placement rates and publishes all results. The institution has established internal benchmarks and benchmarks itself against peer institutions (where applicable) to determine overall success and achievement. Comparisons to national averages are also used (where applicable) as well.
Student Achievement Goals (Threshold Targets):
The following criteria to achieve Student Achievement Goals, which were set by the Administrative Leadership Team at Lawson State, exist for student success and achievement and align and support the College's Mission:
The goals and outcomes that measure Student Achievement at the College are:
To assess these identified goals and outcomes, the College uses the following: (1) IPEDS Completion Rates; (2) Course Completion Rates; (3) Fall-to-Fall Retention Rates; (4) Graduation Rates; (5) Transfer "Ready" Rates; (6) NCLEX--Nursing Licensure Examination pass rates, and (6) Job Placement Results. If results are not met, the College works through targeted Divisions and Departments to address critical shortfalls.
While 26.8% of its student population is of traditional college age (between 18 and 19), 60.2% of students who attend Lawson State are 20 years of age and older. As such, many Lawson State students can be best categorized as working adults. Lawson State also has a higher population of female students, 65.2% versus 34.8% male.
Enrollment by Age (Fall 2024)
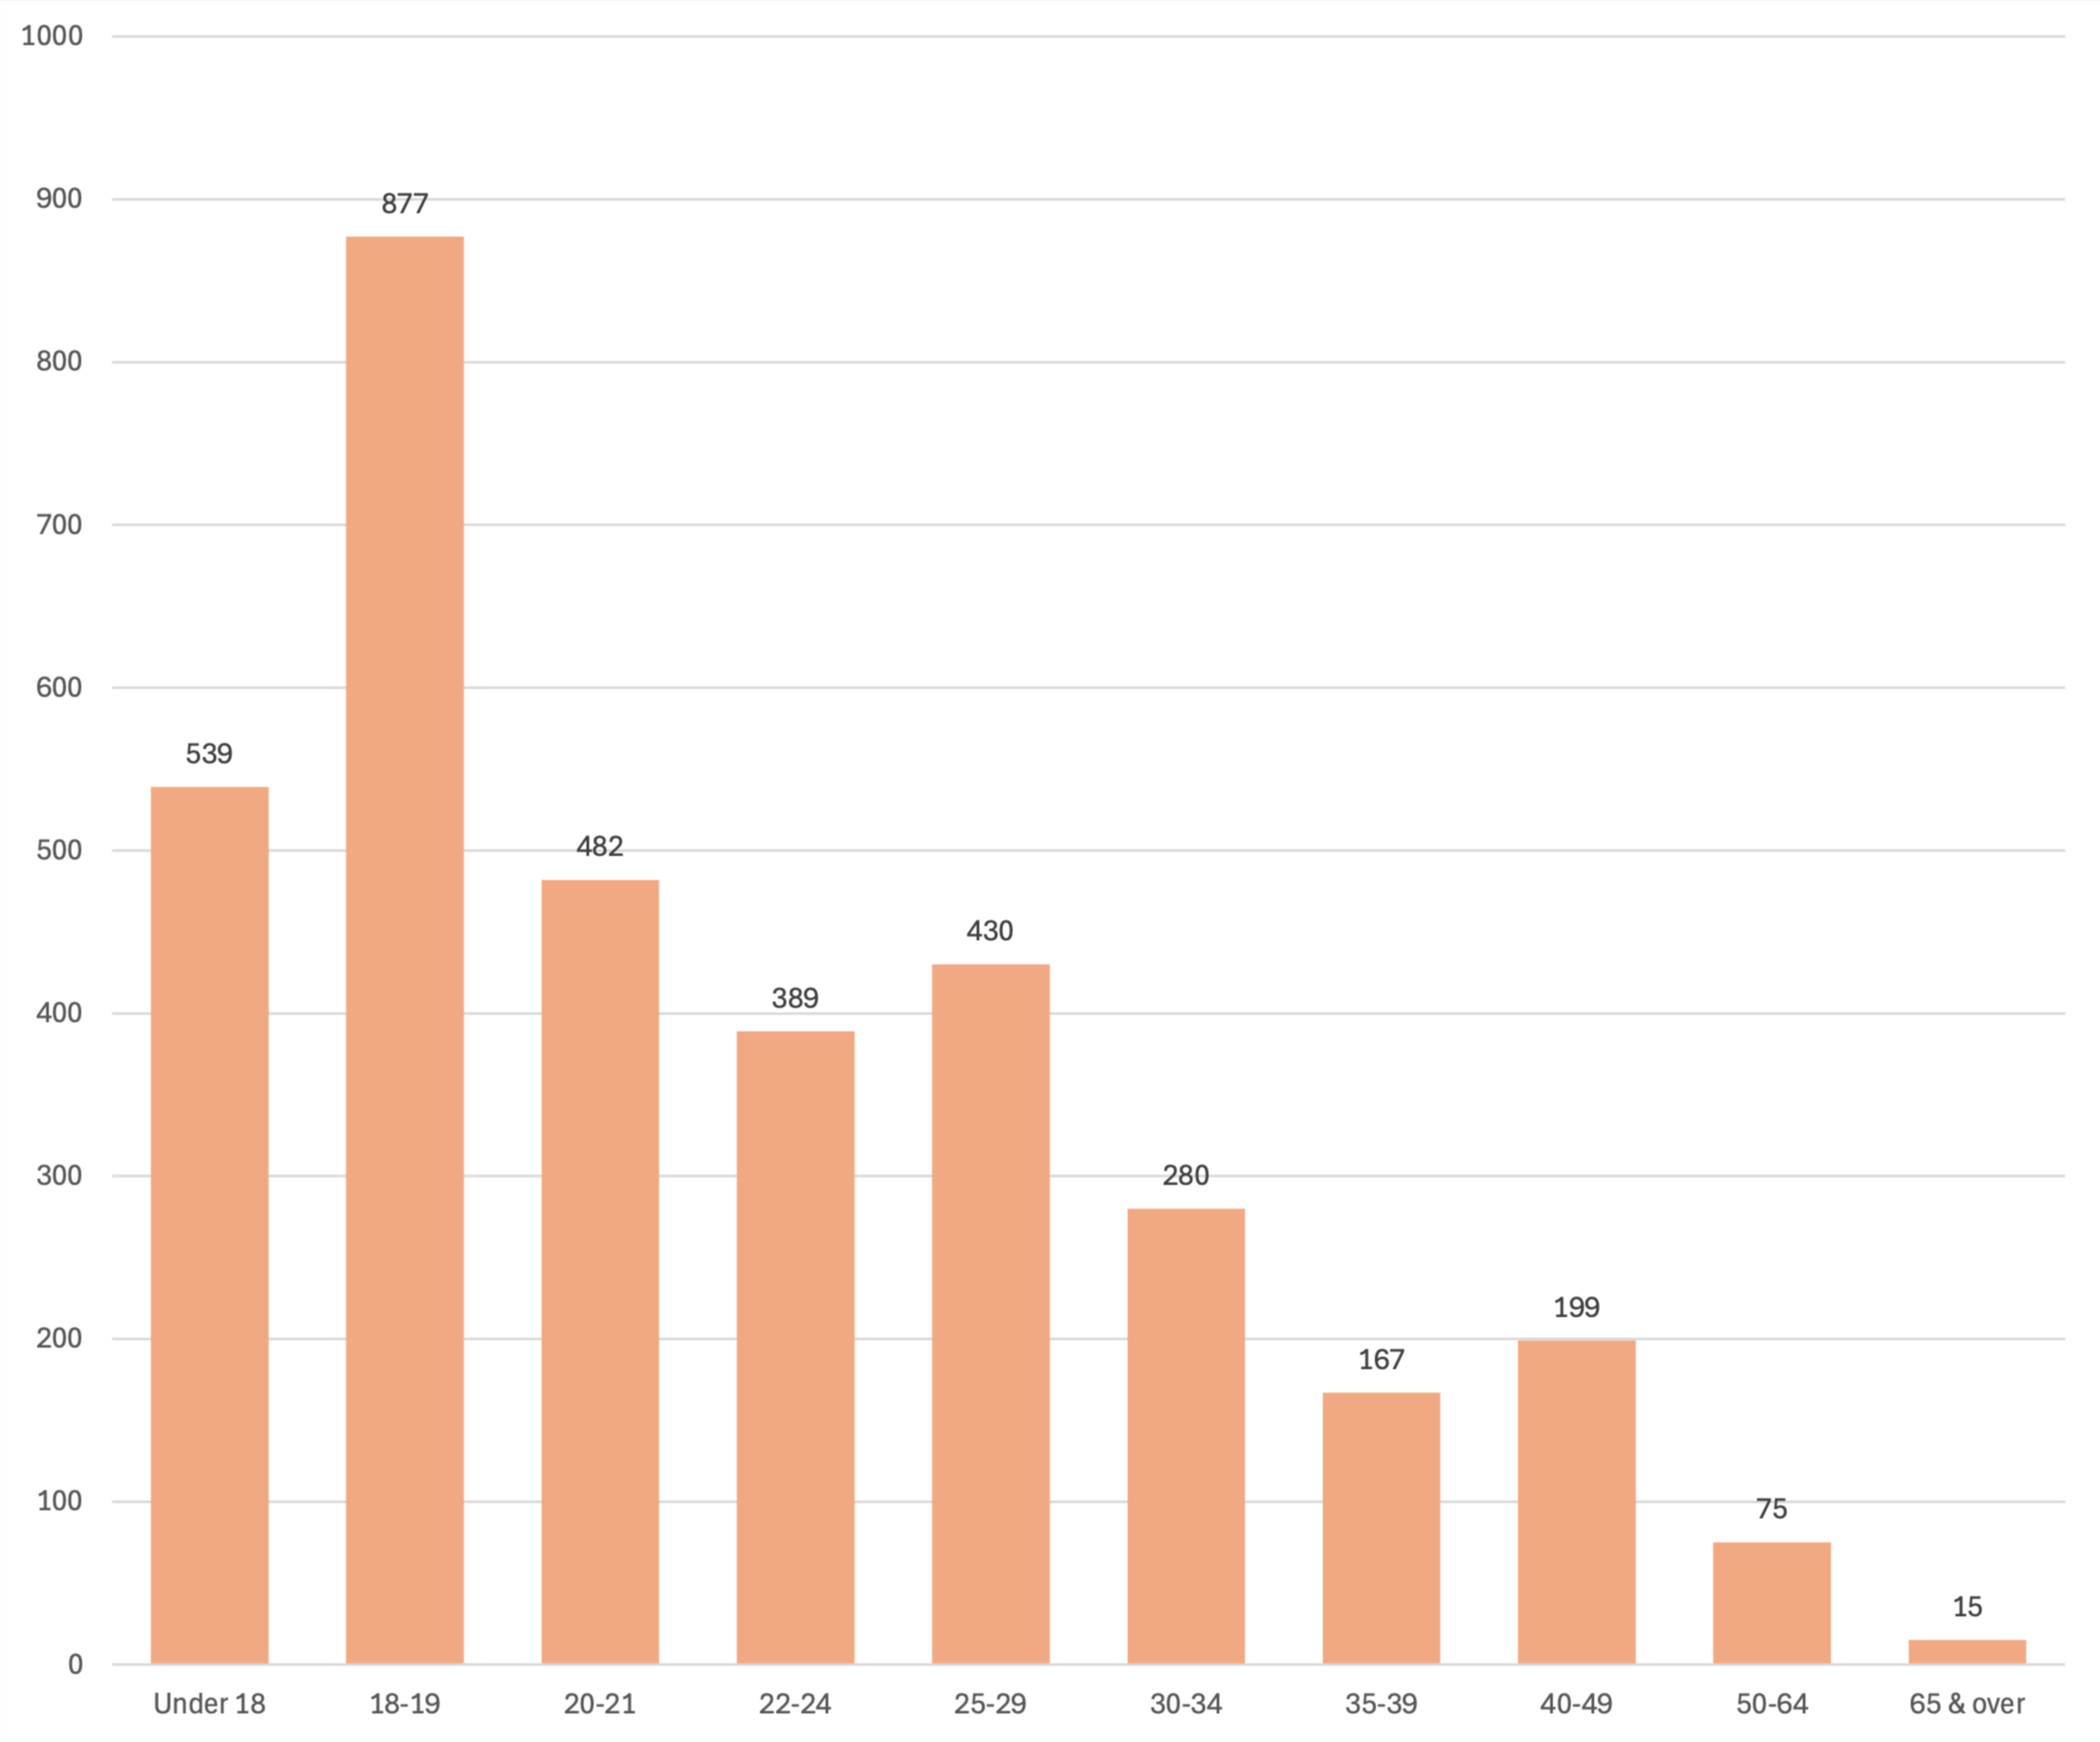
Further, in terms of ethnicity, the College is 81.2% African American, 11.4% White, .6% Hispanic, 5% Multiracial, and 1.8% other. In terms of status, Lawson State also caters to a large part-time student population, where 64.8% of its student population is part-time versus 35.2% full-time.
Given the make-up of the student population, the rational for attending college varies. Some students attend Lawson seeking General Education degrees to transfer to a four-year college, others are seeking to acquire a specific skill, others come to enroll in a few courses typically associated with work, and others are seeking a specific skill to enhance job skills or to make them eligible for work. For some, it could be to secure their GED or obtain Workforce Skills. As such, the College offers a broad scope of Program Offerings to include General Studies (geared towards Transfer Students), Career Technical options, Business Technologies, Health Professions, and also GED courses and Workforce Development opportunities.
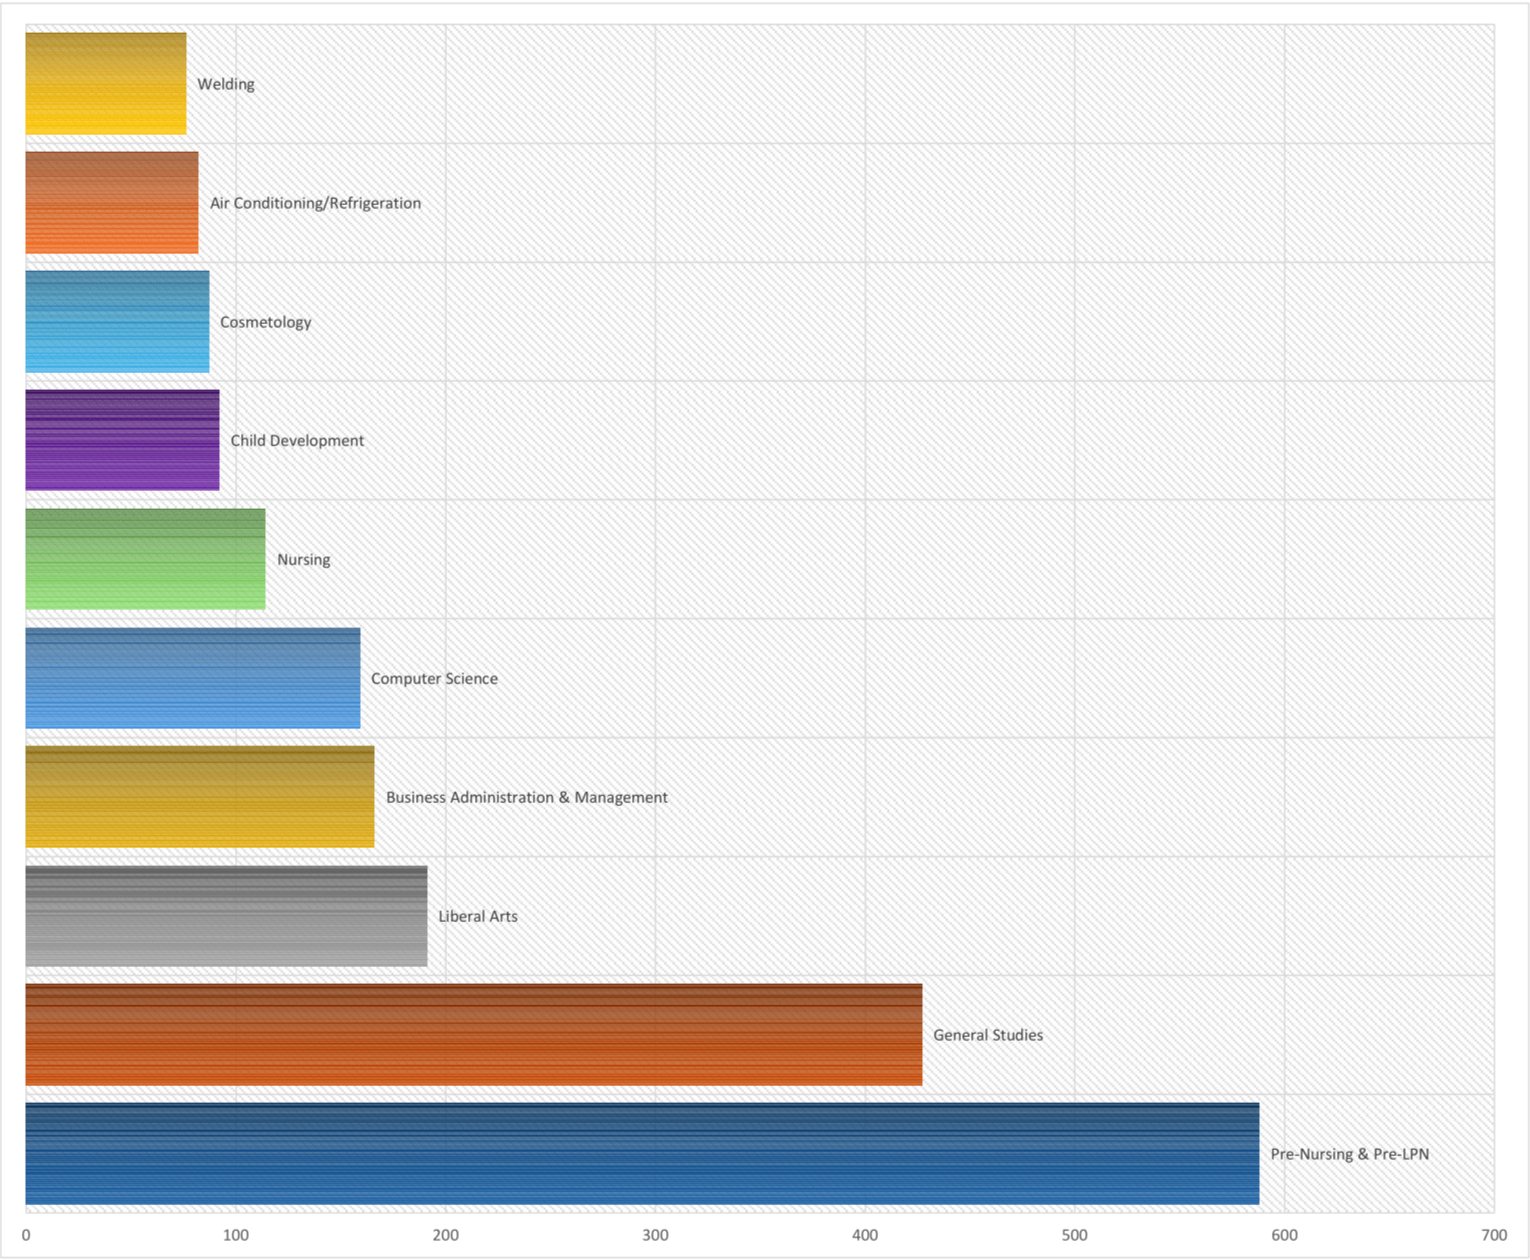
Program demographics within Lawson's Program Areas of Study are varied and reflect the broad diversity of interest of students at Lawson State. The top 10 largest programs at the College are: Pre-Nursing & Pre-LPN, General Studies, Business Administration & Management, Computer Science, Nursing, Child Development, Air Conditioning/Refrigeration, Cosmetology, Business Administration, and Culinary Arts.
Top 10 Enrolled Programs (Fall 2024)
The College offers a variety of programs of study to suit its student population. In doing so, not only does the College serve its student population well, but it also prepare students for gainful employment, career advancement, college transfer, and workforce development.
In addition, the College provides flexible scheduling, which makes higher education success more obtainable. Classes for traditional and non-traditional students are available during the day, evening, and online to accommodate individual needs.
Enrollment by Course Type (Fall 2024)
")
To make appropriate decisions relative to curriculum and course content, Lawson State Community College evaluates course completion data.
The table below provides the data for academic years 2019 thru 2025. All data points were secured from the state-wide reporting system (Argos/DAX). Success is defined by completing a course with a grade of “C†or better, with a grade of “D†or “F†indicating Non-Success. Lawson sets a college-wide internal benchmark of 70% (passing). Based on the data results, Lawson State has met this benchmark (which is 70% passing) over the last six years and currently has a 73.2% pass rate at the institution. This is extremely impressive given the time period does include COVID years.
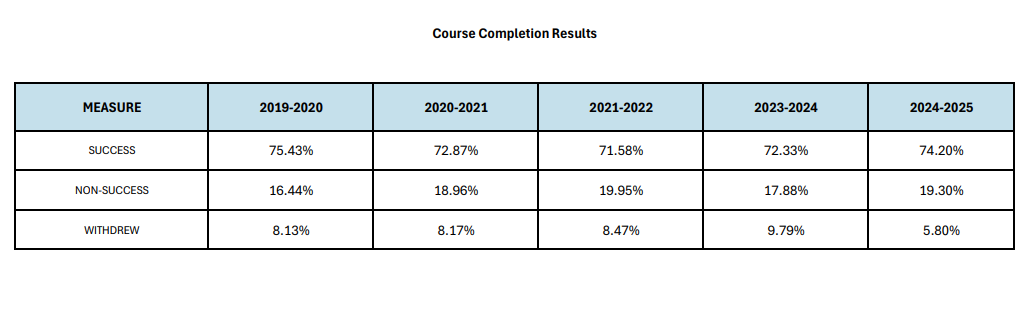
*Success is defined as a grade of C or higher. **Includes Fall and Spring terms only
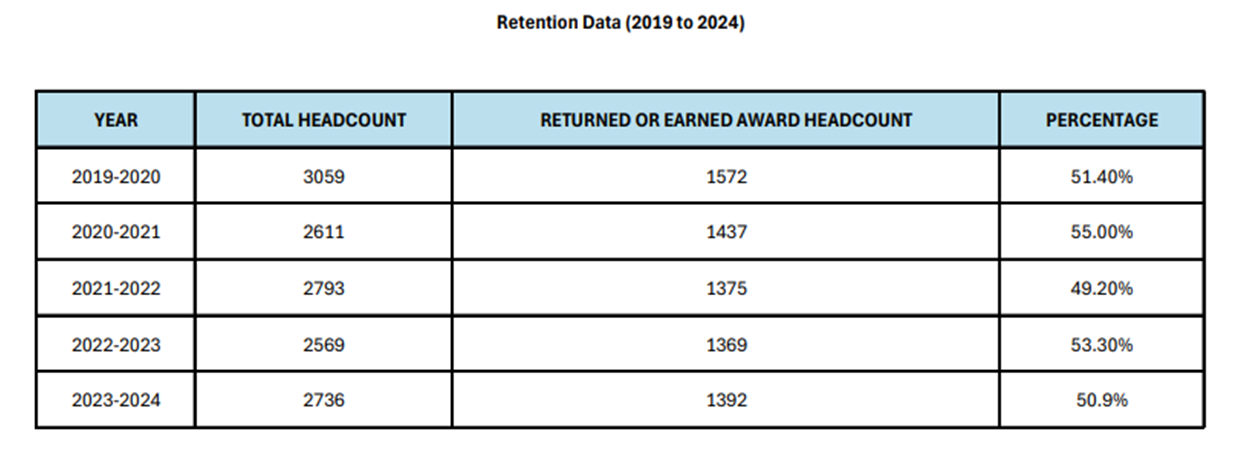
Other useful tools to evaluate student achievement are fall-to-fall retention rates, 150% graduation rate, and the transfer rate.
Retention rate is defined as the percentage of a school's first-time, first-year undergraduate students who continue at that school the next year. For example, a student who studies full-time in the fall semester and keeps on studying in the program in the next fall semester is counted in this rate.
In looking at Lawson State's current retention rates of 51.4% (which looks at full and part-time combined students), the College is meeting its pre-set benchmark of 42% retained. This trend of meeting the College's benchmark has been substantiated by analyzing present trend data reports on retention rates at the College.
Further, even though the College continues to meet this benchmark, retention and methods to improve retention maintain itself as a central focus throughout the college. In fact, the College's QEP: Race to the Finish, centers on retention and completion, for it remains a key and vital component to achieving the College's mission overall. In addition, the College utilizes professional development training opportunities to focus on retention efforts college-wide and has had guest speakers on campus to address issues of retention with faculty and staff. Thus, retention tends to be a core focus at the institution.
Another important factor in assessing achievement of goals and mission of the institution is reviewing and comparing the College in terms of its graduation rate and transfer rate.
Graduation rate is the percentage of a school's first-time, first-year undergraduate students who complete their program within 150% of the published time for the program. For example, for a four-year degree program, entering students who complete within six years are counted as graduates.
Based on the most recently collected data, Lawson State has a current graduation rate of 26%
Graduation Rate (2015 - 2021)
| FALL COHORT |
2021 (as reported in 2024) |
2020 (as reported in 2023) |
2019 (as reported in 2022) |
2018 (as reported in 2021) |
2017 (as reported in 2020) |
|
Graduation Rate 150% |
26% | 26% | 23% | 25% | 21% |
It is difficult for community colleges to gauge success on graduation results exclusively; that is due in large part to the many roles that the College plays within its community and through its actions to serve its diverse population of students. For example, some students enter the College with the intent of taking transfer credits and transfer early without graduating. The College, then, views this as achieving part of this mission. Further, some students enroll in Lawson to acquire specific skill sets to enhance their abilities in the workforce, not necessarily to achieve a full certificate or degree. Lawson views its ability to address this student and his/her/their needs as equally important in fulfilling part of its mission.
In assessing its graduation rate, College does compare itself to other community colleges within the Alabama Community College System. In doing so, it helps to put it current 26% graduation rate into perspective.
Data secured from IPEDS is based on a 150% graduation rate and is reported in the rears. Information for 2022 rates from other schools will not be available until late-2025. So, although 2021 data is available for Lawson (as shown in the above "Graduation Rate" chart) 2019 numbers will be analyzed for this discussion.
Graduation Rate Comparison with Other Two-year Colleges
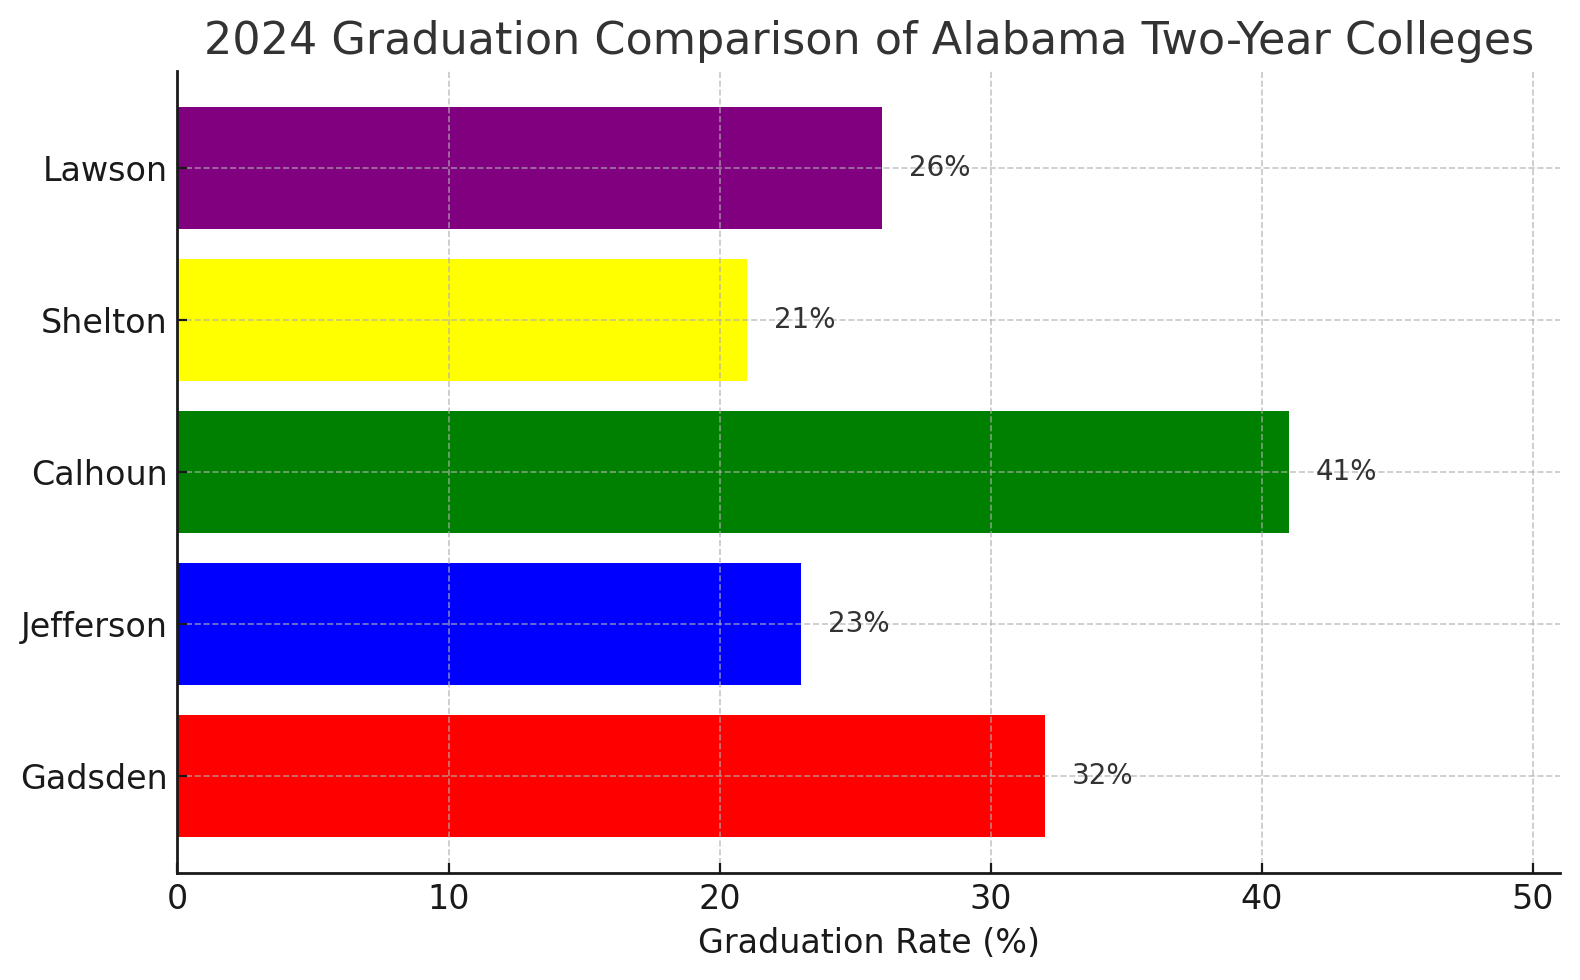
In 2024, Lawson State achieved a 26% graduation rate, positioning the college in the middle range among its Alabama two-year peers. Lawson outperformed Jefferson (23%) and Shelton (21%), but fell short of Gadsden (32%) and Calhoun (41%).
This standing reflects solid performance, yet highlights an opportunity to strengthen Lawson’s competitive position. Closing the gap with higher-performing institutions will require targeted strategies in retention, advising, and completion initiatives. By building on its current foundation, Lawson State is well-positioned to elevate outcomes and move closer to the top of the sector.
The College has implemented several initiatives, including QEP: Race to the Finish, in an effort to highlight completion and transfer importance. In doing so, the College has conducted several work / professional development sessions examining how the College can address and improve retention. These initiatives focus largely on: 1.) Advancing student knowledge and understanding of the Alabama Transfers guide which outlines what courses (if taken at Lawson) will transfer to their select or intended four-year university; and 2.) Providing better guidance and advisement about the "15 to Finish" campaign that is designed to help students graduate and stay in school. Other initiatives are mentioned below. Collectively, these efforts work to improve graduation, retention and transfer "ready" rates.
Initiatives to Promote Graduation and Transfer "Ready" Rates:
Transfer "Ready" Rate:
Another measure that the College uses to assess student achievement is its Transfer "Ready Rate". This rate is determined by two means: (First Measure): The first measure looks at the percentage of transferable Associate degrees (A.A. and A.S) awarded at the institution as compared to the percentage of total awards awarded in a given year. In order to meet the college’s threshold, of 25%, the Associate awards MUST represent at least 25% of the awards earned by students attending Lawson State annually.
In examining the Alabama Commission of Higher Education Degrees Award listing, the chart on the following page (details out the specific awards received annually). In order to calculate the initial Transfer Ready Rate, the college, flags and/or isolates the transferable degrees (A.A and A.S degrees) and adds up the number of degrees awarded within those specific programs of study. Once it has that number, it then calculates the percentage of the graduating class and measures whether or not that percentage is at least 25% of the graduating class.
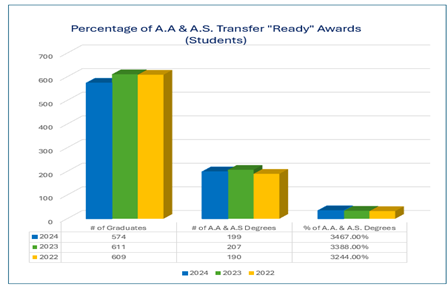
In examining these results, Lawson State is meeting the benchmark of 25%, for in looking at the data results from 2024, 2023 and 2022, the percentage of A.A and A.S. awarded annually ranges from 32.44 to 34.67%.
(Second Measure): The second measure used to analyze Transfer Readiness is whether or not Lawson students actually transferred to a four year college
To evaluate this, the college uses the Alabama Commission on Higher Education (ACHE) Annual Transfer Reports, which provide detailed data on how many Lawson State students transferred and to which institutions, by academic year.
If is difficult to track transfer students by name. Hence, the ACHE Transfer Report includes only new undergraduate transfer students by number, not by student names. Thus, without names, Lawson State compares this data to the number of A.A. and A.S. degrees awarded annually to assess alignment between graduates and actual new transfers reported each year. The college uses this comparison to measure its effectiveness in preparing students to transfer to four-year colleges. Keep in mind that student decisions to transfer and when vary greatly. Thus, the college uses the ACHE Transfer rates as a measure in comparison to its graduation rates--specifically looking for alignment only, for the student populations could differ. Meaning that the ACHE Transfer data could have a mixture of students from different graduating classes. Thereby, the goal of the college is to measure the synergy/correlation between the number of transfer awards going out each year compared to the number of new transfer students (from Lawson) enrolling in four-year universities (regardless of when the student graduated Lawson State). The college sets a 50% alignment rate (between these two key markers) as its goal.
According to the Alabama Commission of Higher Education data:
Based on the figures reported by ACHE, it is evident that new transfer students comprise more than 50% alignment with each graduating class.
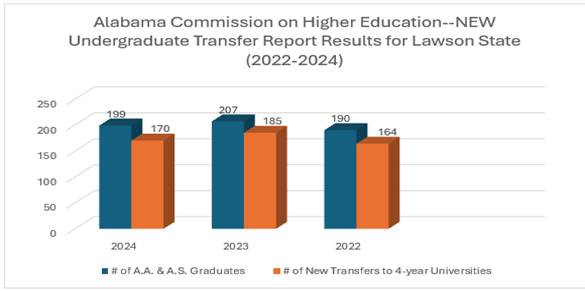
Disclaimer: ACHE reports do not include out-of-state transfers, so actual transfer numbers may be higher.
As previously noted, Nursing is the largest program at the College and drives enrollment to a large degree. Thus, given its imprint on the College and the overall number of students enrolled, results from the Nursing Licensure exam are used as a measure of student achievement.
The College has two Health Professions Programs which require state licensing prior to becoming employed in field: the Associate Degree Nursing and Practical Nursing. Both the Associate and Practical Nursing Programs are approved by the Alabama Board of Nursing and are accredited by ACEN (Accreditation Commission for Education in Nursing). Candidates for licensure must pass the National Council Licensure Examination for Registered Nurses (NCLEX--RN) or the National Council Licensure Examination for Practical Nurses (NCLEX-PN), depending on their completed program of study.
The Alabama State Board of Nursing currently has a benchmark of 80% passage for the NCLEX. Both the Associate Degree Nursing Program and the Practical Nursing Program have exceeded this benchmark for the past three testing cycles. Furthermore, the Associate Degree Nursing Program is always listed Top 10 in the state and has been as high has #1 in the state several times. This ranking is in large part due to with the outstanding success this program has had with its pass rates on the NCLEX exam.
Lawson State, to ensure it maintains a high pass rate, requires all students take an NCLEX Bootcamp to prepare for the exam and does extensive program and curricula reviews to provide for engaged and hands-on learning opportunities for nursing students. The program also has invested heavily in producing a state-of-the-art simulation lab complete with interactive patient simulators.
Associate Degree Nursing Program: NCLEX Pass Rates
| YEAR |
NUMBER OF STUDENTS TESTED |
NUMBER OF STUDENTS PASSED | LAWSON'S NCLEX PASS RATE | STATE NCLEX PASS RATE BENCHMARK |
NATIONAL NCLEX MEAN PASS RATE |
| 2020 | 47 | 45 | 95.7% | 80% | 86.6% |
| 2021 | 39 | 35 | 89.7% | 80% | 82.8% |
| 2022 | 30 | 25 | 83.3% | 80% | 79.9% |
| 2023 | 42 | 40 | 95.24% | 80% | 88.56% |
| 2024 | 36 | 35 | 97.22% | 80% | 91.20% |
Practical Nursing Program: NCLEX Pass Rates
| YEAR |
NUMBER OF STUDENTS TESTED |
NUMBER OF STUDENTS PASSED | LAWSON'S NCLEX PASS RATE | STATE NCLEX PASS RATE BENCHMARK |
NATIONAL NCLEX MEAN PASS RATE |
| 2020 | 21 | 21 | 100% | 80% | 83.1% |
| 2021 | 18 | 17 | 94.4% | 80% | 79.6% |
| 2022 | 23 | 22 | 95.7% | 80% | 79.9% |
| 2023 | 17 | 17 | 100% | 80% | 86.67% |
| 2024 | 14 | 12 | 85.7% | 80% | 88.4% |
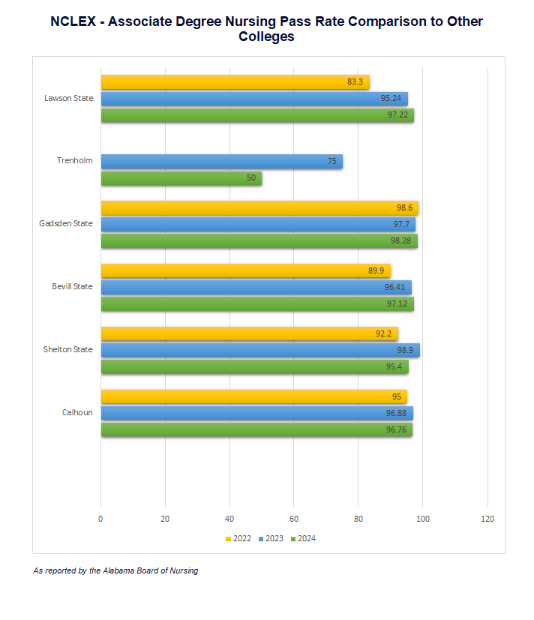
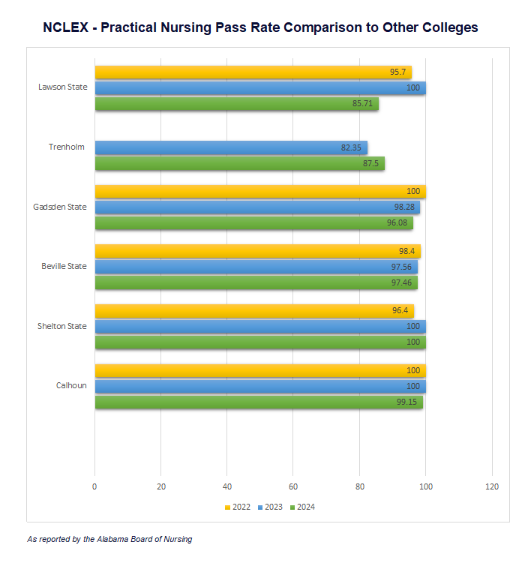
The next two charts show an NCLEX Pass Rate comparison of Lawson State to other, similiar two-year state community colleges.The other community colleges were chosen based on location to Lawson State and their size.
The Alabama Board of Cosmetology & Barbering does not establish a benchmark passage rate for the practical or theory licensure examinations. As such Lawson State evaluates passage rates in regards to the passage rates from previous years. The Cosmetology departments sets the goal of surpassing the previous year’s passage rate.
|
*EXAMINATION PERIOD |
NUMBER OF STUDENTS TESTED -PRACTICAL |
PASSED - PRACTICAL |
PASSAGE RATE-PRACTICAL |
NUMBER OF STUDENTS TESTED -THEORY |
PASSED - THEORY |
PASSAGE RATE- THEROY |
|
2024 |
4 |
4 |
100% |
13 |
7 |
53.85% |
|
2025 |
1 |
1 |
100% |
10 |
5 |
50% |
*Calendar year
Another indicator of student success and achievement is the job placement rate. Using the College Perkins Performance Report on Career and Technical Education (CTE), specifically Core Indicator 1P1, placement rates are scrutinized and reviewed yearly. Core Indicator 1P1 requires measuring the percent of CTE concentrators employed, in military, or apprenticeship programs in the 2nd quarter following the term in which they left postsecondary. Statewide goals are determined each year by the Alabama Community College System.
Defined as percentages of career tech concentrators employed, in military or apprenticeship programs in the 2nd quarter following the term they left postsecondary institution.
|
Year |
Job Placement Rate (Lawson State) |
State Target Level |
|
2023-2024 |
94.1% |
75.2% |
|
2022-2023 |
82.0% |
74.2% |
|
2021-2022 |
82.0% |
73.2% |
|
2020-2021 |
84.0% |
72.2% |